 |
|||||||||||||
| Ocean and Fishery Sciences Home Page | News | Make a Gift | |||||||||||||
|
December 2008 | Return to issue home
UW Team Drives Ocean-Observing Project Closer to Reality
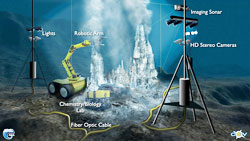
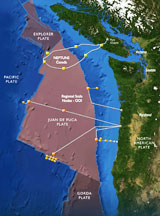
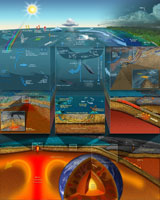
In the future, deep-sea exploration will not be restricted to scientists on research vessels equipped with remote-controlled submarines. Anyone with an Internet connection will have access to data and images from the ocean’s mysterious and remote depths. The technology exists, thanks to the data and power capacity of fiber-optic telecommunications cable. And the vision exists, thanks in no small part to John Delaney, professor in the UW School of Oceanography. He is the catalyst for the UW role in the National Science Foundation’s Ocean Observatories Initiative (OOI), an ambitious project that proposes to observe, interact with and collect data from hundreds of square miles of deep and coastal ocean using robotic vehicles, real-time video, scientific moorings and thousands of kilometers of electro/fiber-optic cable loaded with instruments. The OOI network will span the Western Hemisphere and be connected to the Internet, enabling real-time interaction with the ocean from anywhere on Earth. After more than 10 years of planning, the initiative has recently achieved several significant milestones. Construction could begin as early as 2010, pending a final design review. The UW component of OOI is known as the Regional Scale Nodes (RSN) program and evolved from another research project called NEPTUNE. Delaney, the RSN’s principal investigator and director, and a large team of scientists and engineers are designing and developing the RSN. The UW’s Applied Physics Laboratory (APL) and the School of Oceanography are major collaborators on the project. Gary Harkins, director of APL’s Electronic Systems Department, is the project’s chief engineer.
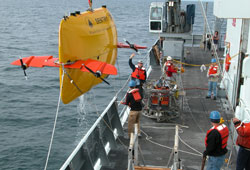
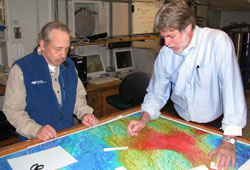
Oceanography’s Pete Barletto is RSN project manager and brings 33 years of experience in the submarine telecommunications cable industry to the job. He is in charge of overseeing implementation of the project, which has nine primary nodes, 137 sensors, two vertical moorings, 1,184 kilometers of backbone cable and 307 kilometers of extension cables—all of which spans the Juan de Fuca tectonic plate at depths ranging from a few hundred to thousands of meters below the surface of the northeast Pacific Ocean. “The good science is in the dangerous areas,” Barletto notes, referencing the fault zones, underwater volcanoes, and severely uneven seafloor where cable will be placed. “Our challenge is to figure out how to approach that and minimize the risks.” One approach is to carefully search for safe installation sites. In July 2008, Deborah Kelley, another professor from the School of Oceanography, and Delaney led a research cruise on the R/V Thomas G. Thompson to map the seafloor in two areas of high scientific interest. Using Sentry, a sonar-equipped autonomous underwater vehicle from the Woods Hole Oceanographic Institution, the expedition created highly detailed maps of the seafloor.
The areas of interest included sites near the Hydrate Ridge, just off the coast of Newport, Oregon, and Axial Volcano, about 250 miles off the central Oregon coast. Instruments at these locations will connect to the network's undersea cable via nodes. These large, heavy yet delicate power and communication stations are designed to last 25 years. The sites will also include instruments on moored cables and platforms that will collect data at different depths within the water column. In addition to ocean siting, the project must address the question of where to bring cables ashore. “We studied nine potential landing stations,“ Barletto says. “The Washington landings were too distant, and the state poses a difficult permitting challenge. Oregon has sites that are closer to the seafloor nodes and offers a friendlier permitting process than Washington for submarine cable landings.” An Oregon shore site, he says, is also more convenient for terrestrial connectivity. Data will flow to a facility in Portland, where it will be transferred to the OOI.
The OOI cleared an important hurdle in late 2007, when the program went through a preliminary design review. “This was a critical milestone, and we passed with flying colors. The whole program did well,” said Delaney.
The crucial milestone that looms this fall, the rigorous final design review, will be a final reality check, with $330 million and a revolutionary concept of ocean research at stake. If the OOI passes this test, the program will need approval from NSF Director Arden Bement and the 24-member National Science Board in Spring 2009. With these approvals, money could begin to flow in fiscal year 2010. Construction of the project is expected to take about five years. The UW is a natural partner in the OOI, given COFS’ standing as a major marine research and education institution and the region’s proximity to the Juan de Fuca tectonic plate. The entire UW team looks forward to the new information that an underwater regional cabled network will provide, and how it will change the way we see the world. “The added capabilities of ocean-observing technology are crucial to advancing the ocean sciences,” says Russell McDuff, professor and director of the UW School of Oceanography. “Our challenge is to enable students with the skills to use these new sources of information.” Most of us experience the ocean as waves breaking on the shore, observes Delaney, but he notes that the ocean has a profound influence on the continents. He calls the ocean the “Earth’s thermostat,” for its role in transferal and circulation of energy; its “chemostat,” as an absorber of carbon dioxide; and its “biostat,” given its ability to become “incredibly productive, very quickly.”
Delaney says that understanding the ocean is becoming more important, as the Earth’s population deals with the causes and effects of climate change. He believes that by putting revolutionary research capability into the ocean, the OOI will “fundamentally change the human perception of the effect of the ocean on our planet.” “The ocean is central to the habitability of the planet and the quality of life on the continents,” he says. “It is the central driving engine of the planet’s climatic stability. To understand the planet, you must understand the ocean.” Learn more about the Ocean Observatories Initiative at www.ooi.washington.edu. * Graphic illustrations by Center for Environmental Visualization / ** Photos by Mitchell Elend December 2008 | Return to issue home | |||||||||||||
|
|||||||||||||